はじめに
org-mode と R を 組み合わせたら, 予想外に心地よかったので, メモメモ.
できること
テキスト + コード + グラフ が ひとつのファイルのなかにおさまるのだ.
- org-mode で書いているテキストの中にコードを埋め込むことができる.
- org-mode で書いているテキストの中にグラフを埋め込むことができる.
- org-mode で書いているテキストの中のコードをその場で実行できる.
サンプル
  #+OPTIONS: toc:nil
  * Lab3
  ** 1.
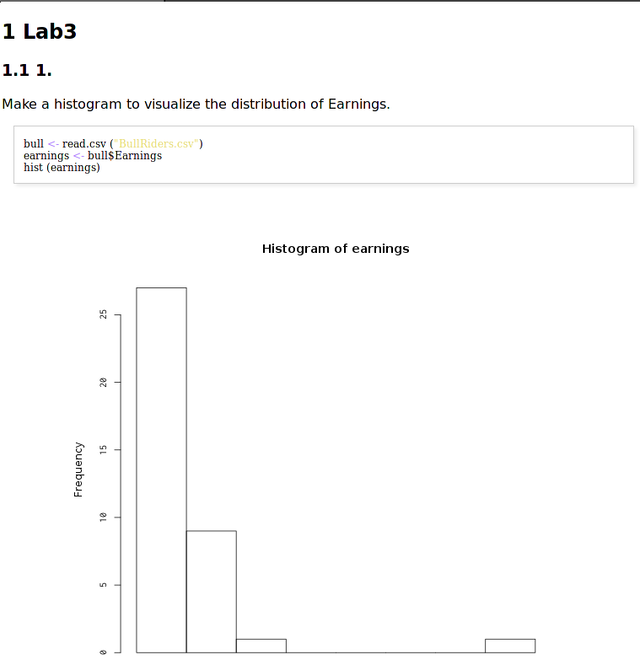
     Make a histogram to visualize the distribution of Earnings.

  #+name: earnings
  #+begin_src R :file earinings.png :width 600 :height 600 :results graphics :session ex :export both
  bull <- read.csv ("BullRiders.csv")
  earnings <- bull$Earnings
  hist (earnings)
  #+end_src

  #+RESULTS:
  [[file:earinings.png]]

  ** 2.
     Generate the appropriate descriptive
     statistics for this distribution.

  #+name: earnings-median
  #+begin_src R :session ex :export both
  median (earnings)
  #+end_src

  #+RESULTS:
  : 111147.63

  #+name: earnings-mean
  #+begin_src R :session ex :export both
  max (earnings)
  #+end_src

  #+RESULTS:

: 1464475.61

設定
org-mode からコードを実行する
まずは, 以下の設定が必須
(org-babel-do-load-languages
 'org-babel-load-languages
 '((R . t)
   )
 )
begin_src のところで C-c C-c をたたいて 評価する.
評価するときにいちいち質問されないようにするために,以下を書く.
(setq org-confirm-babel-evaluate nil)
org-mode でファイルをひらくときに,inline-image があれば読み込み.
(add-hook 'org-babel-after-execute-hook 'org-display-inline-images)
(add-hook 'org-mode-hook 'org-display-inline-images)
画像変換 : :file earinings.png :width 600 :height 600 :results graphics
グラフを生成するには, org-babel Header に以下をかく.
:file earinings.png :width 600 :height 600 :results graphics
インタプリタ :session hogehoge
インタプリタをもつ言語では, :session hogehoge を記述することで, hogehoge バッファでセッションが開始する.
なにがうれしいかというと, 複数の code block の間で, 変数を共有することができるのだ.
さいごに
文芸的プログラミング, 普通のプログラミングにはつかいどころがないと 思っていた.絵空事だとおもってた.
R 言語のようにグラフをともなうものにこそ, そのコンセプトは光り輝くのだと思った.
Reproducible Research というバズワードも最近になって話題になった.
これを機会に,もってみんな Emacs と org-mode をつかうべし.
Bookmarks
- R Source Code Blocks in Org Mode
- Emacs 上のマルチな実行環境, Org-babel - sheephead
- https://github.com/erikriverson/org-mode-R-tutorial/blob/master/org-mode-R-tutorial.org
R 言語と org-mode で Reproducible Research を.